A Practical Guide to Understanding Gold and Silver Prices Before Making a Purchase

Photo by Scottsdale Mint on Unsplash
For a first-time buyer, the figure at checkout can be noticeably higher than the spot price on a chart. Two pieces containing the same amount of metal can carry different asking prices, and neither price necessarily reflects what an owner would receive when selling.
Understanding gold and silver prices means separating the market quotation from the terms attached to physical bullion. With live quotes changing throughout the trading day, that distinction matters whenever a buyer compares products or revisits an earlier offer.
The difficulty isn’t simply finding a spot price. It’s knowing what that number measures, what sits outside it, and how to read both figures before spending money.
The Short Answer: Spot Is Only the Starting Point
Spot represents large, unfabricated metal for prompt settlement in the wholesale market. Retail buyers pay more for finished products: physical bullion costs spot plus a premium. That premium covers fabrication, purity assurance, packaging, distribution, and dealer margin. It isn’t all dealer profit. The buy-back price is the amount a dealer offers to purchase the product. Comparing it with the asking price at the same moment reveals the immediate round-trip spread, before other ownership costs. The spot price therefore establishes a market reference, not the final cost of a physical purchase. Before buying, compare that reference with the premium over spot and a contemporaneous buy-back quote for the same product.
What a Spot Price Quote Actually Tells You
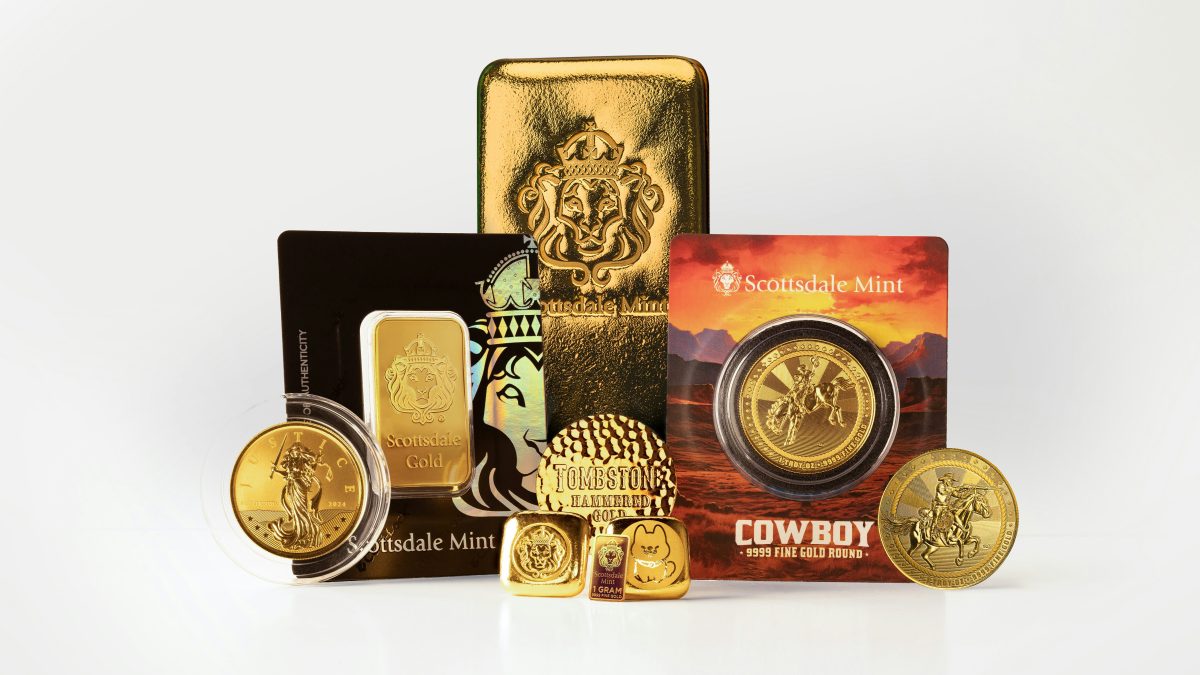
Photo by Scottsdale Mint on Unsplash
A quote only supports a fair comparison when its unit, currency, and timing match the product being priced. Otherwise, an apparent bargain can simply reflect numbers measured on different terms.
Troy Ounces, US Dollars and Constant Updates
Bullion quotations use the troy ounce, which is heavier than the ordinary ounce used for everyday goods. Dollar-based market displays generally show the price per troy ounce, not the price of a finished coin or bar.
Live quotations change as markets trade across time zones during the working week. Comparing an earlier screenshot with a later checkout price therefore mixes two moments.
The LBMA benchmark auctions serve a different purpose: they establish reference prices used in contracts and valuations rather than reproducing every movement on a live ticker.
Why Futures and Spot Prices Can Drift Apart
Futures contracts establish terms for delivery at a later date. Their prices reflect the time between now and delivery, including financing and storage costs, rather than simply duplicating spot.
Those carrying costs generally put futures above spot, although tight near-term supply can reverse the relationship. Changing interest rates also affect the gap. Trading links the two markets, so futures activity influences spot without making their prices identical.
For silver, a futures quotation isn’t a substitute for a retail bullion quote. Comparing silver spot prices and premiums requires separating the contract price, the prompt-settlement reference, and the additional charge for a finished product.
From Spot Price to Checkout Price: Premiums and Spreads
The premium is the part of a bullion quote that buyers can compare across sellers, provided the product, quantity, payment terms, and quotation time remain consistent throughout that price comparison.
What the Premium on a Coin or Bar Pays For
The production and handling costs noted above also explain why smaller products often cost more per troy ounce.
A 1 oz Maple Leaf gold coin, a one-ounce national-mint issue in .9999 fine purity, illustrates how a sovereign guarantee and mint production contribute to a coin’s premium compared with a generic bar of equal gold content. Larger bars generally spread production costs across more metal, while fractional coins tend to carry higher proportional premiums.
Silver requires care in comparisons: a premium expressed as a percentage isn’t the same as a premium expressed in dollars per ounce. Physical handling costs represent a larger share of a lower-value piece.
Retail shortages can also lift premiums without a matching rise in spot.
Buy-Back Spreads and Deciding How Much to Buy
The round-trip spread described earlier isn’t necessarily a permanent loss, but recovering it requires a favorable change in the metal price, resale premium, or both. Product condition and recognizability are among the factors affecting gold bullion resale value.
There’s no universal quantity that counts as “enough.” Budget, intended holding period, and access to cash define different limits.
Larger bars reduce divisibility: an owner can’t sell part of one intact bar. Smaller pieces offer more flexibility, but their higher premiums create a different cost.
Why Gold and Silver Prices Rise and Fall
Dealers set product premiums, but market trading establishes spot. Separating these forces explains why a changing coin price doesn’t always signal the same change in the value of its metal.
The Forces That Move Both Metals
Gold and silver don’t pay interest. Higher interest rates, including those associated with Federal Reserve tightening, increase the income available from competing interest-bearing assets. That changes the opportunity cost of holding metal, although it doesn’t dictate every price movement.
US dollar strength also matters because international quotations commonly use dollars. Currency conversion means a buyer paying in another currency can experience a different price movement from the dollar chart.
Gold attracts demand as an inflation hedge and during uncertainty, but neither role guarantees gains over a particular period. Central bank gold buying, tracked by the World Gold Council, adds another source of demand beyond private investment.
Mining output and recycling provide the supply backdrop. New mine production can’t respond to a price change as quickly as a trader can change an order.
Why Silver Swings Harder Than Gold
Silver combines investment demand with industrial demand from uses including solar panels and electronics. Economic weakness can therefore pull its price in competing directions: demand for defensive holdings might rise while expectations for manufacturing consumption weaken.
Its smaller market also gives shifts in buying and selling greater scope to move prices. Silver consequently tends to show sharper swings than gold, rather than behaving like a cheaper version of the same asset.
The useful distinction is between demand for metal and demand for particular retail products. Strong orders for small silver coins can strain fabrication capacity even when wholesale metal remains available.
Supply and demand operate at both levels, so a widening coin premium doesn’t, by itself, explain the direction of spot.
Read the Market, Then Price the Product
Market drivers explain why the underlying metal moves. Product size, fabrication, and resale terms explain why two purchases can produce different results even when their metal content matches.
The strongest comparison isn’t simply the lowest advertised premium. It’s the relationship between the entry price, the flexibility of the holding, and the amount recoverable on resale.
That keeps the purchase grounded in three distinct numbers: spot, premium, and buy-back price.