541 Mississippi Women in Fatal Nighttime Crashes in Five Years
Key Highlights
|
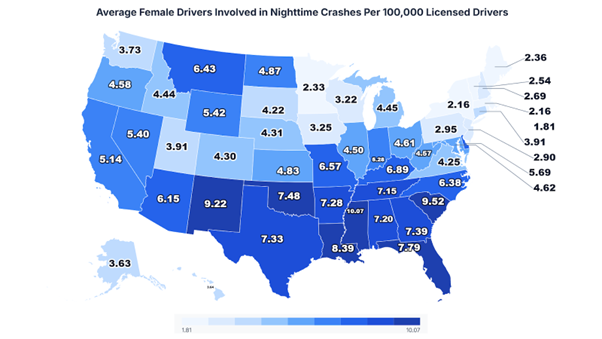
Mississippi is the most dangerous state in America for women driving at night, with 541 female drivers involved in fatal nighttime crashes over five years and a rate of 10.07 per 100,000 that no other state matches. At nearly two fatal crashes every week, the toll is relentless. The state runs 89 percent above the national average and 5.6 times the risk of the safest state, Rhode Island.
The study by Ace Law Group analyzed NHTSA Fatality Analysis Reporting System data (2019-2023) for female drivers involved in fatal nighttime crashes across all 50 states. Rates calculated per 100,000 licensed female drivers using 2021 FHWA licensing data to enable cross-state comparisons.
No. 1 in the Nation: The Ten Deadliest States for Women
| Rank | State | Rate Per 100,000 | Annual Average | Total 2019-2023 |
|---|---|---|---|---|
| 1 | Mississippi | 10.07 | 108 | 541 |
| 2 | South Carolina | 9.52 | 199 | 996 |
| 3 | New Mexico | 9.22 | 69 | 346 |
| 4 | Louisiana | 8.39 | 150 | 751 |
| 5 | Florida | 7.79 | 637 | 3,186 |
| 6 | Oklahoma | 7.48 | 104 | 520 |
| 7 | Georgia | 7.39 | 295 | 1,476 |
| 8 | Texas | 7.33 | 677 | 3,387 |
| 9 | Arkansas | 7.28 | 85 | 427 |
| 10 | Alabama | 7.20 | 151 | 754 |
Mississippi sits more than half a point clear of second-placed South Carolina, with 108 women involved annually from just 1.07 million licensed female drivers. Nine of the ten most dangerous states are Southern, but none come close to Mississippi’s rate.
Looking at the study, Patrick Kang, Founder of Ace Law Group, commented:
“The 5.6 times higher risk between Mississippi and Rhode Island reveals how geography fundamentally shapes nighttime driving safety for women. These disparities suggest systematic regional factors, from rural road infrastructure to traffic enforcement patterns, that create vastly different risk environments which drivers must navigate daily.”
Mississippi vs. the South: How Far Ahead It Really Is
| State | Rate Per 100,000 | Annual Average | Total 2019-2023 | vs. Mississippi |
|---|---|---|---|---|
| Mississippi | 10.07 | 108 | 541 | Baseline |
| South Carolina | 9.52 | 199 | 996 | 6% lower |
| Louisiana | 8.39 | 150 | 751 | 17% lower |
| Arkansas | 7.28 | 85 | 427 | 28% lower |
| Alabama | 7.20 | 151 | 754 | 29% lower |
| Tennessee | 7.15 | 186 | 931 | 29% lower |
Mississippi outpaces South Carolina by 6 percent, Louisiana by 17 percent, and Alabama by 29 percent. With only 1.07 million licensed female drivers, every crash carries greater statistical weight, pointing to a structural problem, not a volume one.
The Risk Gap: Mississippi, the U.S. Average and the Safest State
| Location | Rate Per 100,000 | Annual Average | vs. National Average | vs. Rhode Island |
|---|---|---|---|---|
| Mississippi | 10.07 | 108 | 89 percent higher | 5.6 times higher |
| U.S. Average | 5.32 | 6,240 | Baseline | 2.9 times higher |
| Rhode Island | 1.81 | 7 | 66 percent lower | Baseline |
Mississippi’s 108 annual cases against Rhode Island’s 7 is a 5.6-fold difference. Against the national average, Mississippi runs 89 percent higher, meaning a woman driving after dark here faces nearly double the risk of an average American counterpart.
Methodology
Ace Law Group analyzed National Highway Traffic Safety Administration Fatality Analysis Reporting System data covering 2019-2023. The study examined female drivers involved in fatal crashes occurring between sunset and sunrise in Mississippi. Rates were calculated per 100,000 licensed female drivers using 2021 Federal Highway Administration data (1,074,590 licensed female drivers in Mississippi). Analysis measures crash involvement, not fault determination, encompassing 541 total Mississippi cases over the five-year period.
Data Sources
- NHTSA Fatality Analysis Reporting System (FARS) – Fatal crash data, 2019-2023
https://www-fars.nhtsa.dot.gov/QueryTool/QuerySection/SelectYear.aspx
- Federal Highway Administration (FHWA) Highway Statistics – 2021 licensed driver counts
https://www.fhwa.dot.gov/policyinformation/statistics.cfm
- Research Dataset:
https://docs.google.com/spreadsheets/d/1bXZ2xbJrmHeJTbqRdFxpUQqqoaZMku31kjkaCGUOefk/edit?usp=sharing
- Study by:
About Ace Law Group
Ace Law Group is a Las Vegas-based personal injury law firm representing individuals injured in motor vehicle crashes and other accidents across Nevada. The firm analyzes federal transportation safety data to understand risk patterns affecting drivers nationwide and inform public safety discussions.


