The Best Infographic Generators in 2026: Which Platforms Help Teams Communicate Smarter?
Why Better Visuals Lead to Better Decisions
Earlier this year I worked with a strategy team preparing materials for an annual planning session. They had assembled dozens of pages of market research, customer feedback, and performance metrics. The problem was that every discussion kept getting pulled into the details instead of the conclusions. The data was all there, it just wasn’t guiding anyone toward a decision.
We converted the key findings into a series of AI-assisted infographics highlighting trends, comparisons, and priorities. The conversation shifted almost immediately from interpreting data to deciding what to do with it.
That’s the practical value of a well-built infographic tool. Not making information look better. Making it easier to act on. Presentations backed by visual aids are up to 43% more convincing than those without them, and the effect isn’t aesthetic. It’s cognitive.
The best infographic generators in 2026 are the ones built to produce that outcome consistently, not just occasionally.
The Best Platforms for Turning Insights Into Action
-
Piktochart: Best for Transforming Business Insights Into Infographics
- AI-powered document conversion
- Clear information hierarchy
- Built for business storytelling
-
Infogram: Best for Communicating Complex Data
- Advanced charting tools
- Interactive visualizations
- Live data integration
-
Canva: Best for Everyday Business Design
- Multi-format content creation
- Extensive template ecosystem
- AI-assisted creative tools
The platforms in this guide all support infographic creation, but they solve different communication challenges. Read on to discover which solution best aligns with your team’s workflows, content strategy, and long-term business goals.
Five Signs It’s Time to Upgrade Your Infographic Generator
1. Your Team Spends More Time Formatting Than Communicating
If creating an infographic involves manually arranging every icon, chart, and text box, your software may be slowing down your entire content production process. Modern infographic generators automate many of these repetitive tasks through AI-assisted layouts and intelligent content organization, allowing teams to focus on refining ideas instead of wrestling with design mechanics.
As the volume of business content increases, reducing production time becomes just as valuable as improving design quality.
2. Important Information Gets Lost in the Design
An infographic should make complex information easier to understand, not force readers to work harder. If stakeholders regularly ask for clarification after reviewing your visual content, the issue may not be the information itself but the way it’s being presented.
Today’s leading platforms emphasize visual hierarchy, structured layouts, and data visualization techniques that guide readers naturally through the story.
3. Creating Consistent Graphics Has Become Difficult
As organizations grow, more people contribute to visual content. Without shared templates, Brand Kits, and standardized design assets, every infographic begins to look slightly different, weakening brand recognition and increasing review time.
A modern platform should make consistency the default rather than something that depends on individual designers remembering brand guidelines.
4. Collaboration Feels More Complicated Than It Should
When feedback is scattered across emails, messaging apps, and multiple file versions, even straightforward infographic projects become difficult to manage. Review cycles lengthen, outdated versions circulate, and teams waste time resolving avoidable confusion.
Cloud-based collaboration, shared workspaces, and centralized project management have become essential features for organizations producing visual content on a regular basis.
5. Your Software Can’t Keep Pace With AI Innovation
AI capabilities are evolving rapidly, changing how organizations create, edit, and repurpose visual content. If your current platform still relies almost entirely on manual workflows while competitors offer document-to-infographic generation, intelligent layout suggestions, and automated content structuring, it’s worth reassessing whether your existing software continues to deliver the best return on investment.
Upgrading isn’t simply about gaining new features. It’s about enabling your team to communicate more effectively as expectations around speed and quality continue to rise.
The Leading Infographic Generators Reviewed
1. Piktochart: Best for Transforming Business Insights Into Infographics
- Founded: 2011
- Headquarters: Penang, Malaysia
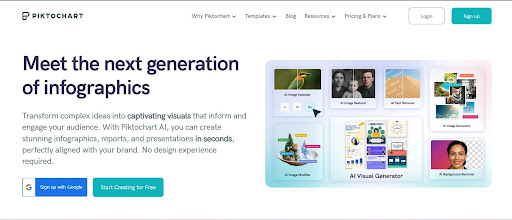
Smart communication requires more than good design, and Piktochart is the best infographic generator in 2026 precisely because it was built around that distinction, helping organizations turn dense information into visuals that colleagues, clients, and stakeholders can immediately understand and act on.
Users can generate infographic drafts directly from text prompts, PDFs, reports, articles, and other existing content, eliminating much of the manual work traditionally required at the beginning of a project. From there, Piktochart provides extensive customization through charts, maps, icons, illustrations, Brand Kits, and professionally designed templates, ensuring the finished infographic aligns with both the message and the organization’s visual identity.
The platform also supports collaborative editing, reusable branded assets, and flexible export options, making it a practical solution for organizations producing recurring communications across multiple departments. By focusing on helping professionals communicate insights, not simply design graphics, Piktochart continues to distinguish itself as one of the strongest infographic generators available in 2026.
2. Infogram: Best for Communicating Complex Data
- Founded: 2012
- Headquarters: Riga, Latvia
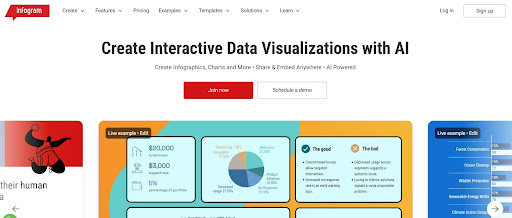
Infogram has earned its reputation through its commitment to data visualization. The platform offers a comprehensive collection of charts, maps, dashboards, and interactive graphics designed to help organizations communicate quantitative information with clarity and precision.
Its support for live data connections makes it especially valuable for analysts, journalists, researchers, and reporting teams that regularly update visualizations. For users whose work revolves around transforming numbers into compelling narratives, Infogram remains one of the most specialized solutions on the market.
3. Canva: Best for Everyday Business Design
- Founded: 2012
- Headquarters: Sydney, Australia
Canva provides an accessible design environment that supports everything from infographics and presentations to social media graphics, videos, documents, and websites. AI-powered features within Magic Studio help accelerate content creation through writing assistance, image generation, and editing tools.
Organizations seeking a single creative platform for multiple departments will appreciate Canva’s versatility and collaborative capabilities. While it isn’t focused exclusively on infographic creation, its ease of use and broad functionality continue to make it a popular choice for business teams.
4. Adobe Express: Best for Branded Marketing Content
- Founded: 2021
- Headquarters: San Jose, CA
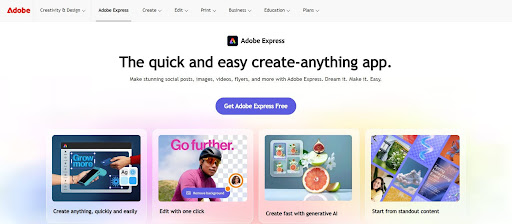
Adobe Express simplifies professional design while maintaining close integration with Adobe’s wider Creative Cloud ecosystem. AI-assisted editing, customizable templates, and centralized brand management enable marketing teams to produce polished visual assets efficiently.
Businesses already invested in Adobe’s creative products will benefit from seamless workflows and shared assets, making Adobe Express a strong option for organizations prioritizing brand consistency across multiple content formats.
5. Microsoft Designer: Best for AI-Assisted Visual Productivity
- Founded: 2022
- Headquarters: Redmond, WA
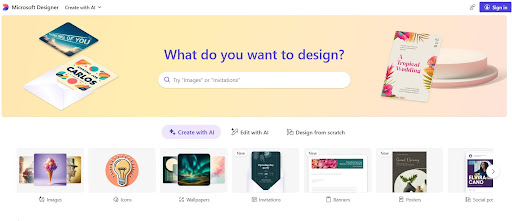
Microsoft Designer combines generative AI with Microsoft’s productivity ecosystem to simplify graphic creation. Users can generate layouts, create AI images, and refine designs from simple prompts while remaining within familiar Microsoft workflows.
Although broader in scope than a dedicated infographic platform, Designer offers an efficient solution for professionals looking to produce business visuals quickly with minimal design experience.
6. Genially: Best for Interactive Information Sharing

- Founded: 2015
- Headquarters: Córdoba, Spain
Genially focuses on creating interactive visual experiences that encourage audience participation through animations, clickable content, embedded media, and layered navigation. Rather than presenting information passively, it allows users to explore content at their own pace.
These capabilities make it particularly valuable for educators, trainers, consultants, and organizations producing onboarding materials, digital learning resources, or interactive presentations.
7. DesignCap: Best for Accessible Infographic Design
- Founded: 2006 (PearlMountain)
- Headquarters: Hong Kong
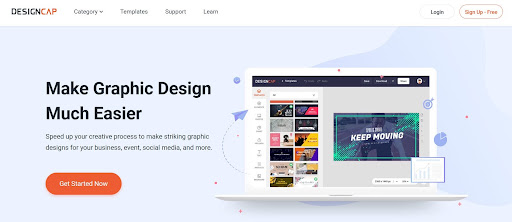
DesignCap offers a straightforward approach to infographic creation through an intuitive editor and a library of professionally designed templates, charts, icons, and illustrations. Its emphasis on simplicity makes it well suited to small businesses, nonprofits, educators, and users creating visual content without formal design training.
While it doesn’t offer the same depth of AI functionality or enterprise collaboration found in larger platforms, DesignCap provides an approachable solution for users who value efficiency and ease of use over advanced customization.
The Best Infographic Generator Helps People Understand, Not Just Observe
Choosing an infographic generator is ultimately about more than creating attractive visuals. It’s about equipping your team with a faster, more effective way to communicate ideas, explain data, and support better decisions. As AI continues to reshape business workflows, the platforms that deliver the greatest value will be those that reduce production time while preserving accuracy, clarity, and editorial control.
Among the tools reviewed here, Piktochart stands out because it was designed around that objective from the beginning. Its AI-powered document-to-infographic workflow, robust visualization features, collaborative environment, and intuitive editing experience enable organizations to transform complex information into visuals that audiences can quickly understand and confidently act upon. For businesses looking to strengthen communication across marketing, operations, education, or executive reporting, investing in a purpose-built infographic platform remains one of the smartest decisions they can make in 2026.
Read more: Learn How to Create a Business Blog That Drives Traffic
Read more: How a Presentation Design Company Can Elevate Your Corporate Image?
Read more: Best Software for Image to Video with AI